Statistics
EpicDraft analyzes your script as you write and reports on it in two places: live figures in the status bar, and a fuller breakdown in the file panel's Review tab.
Where to find it
On desktop, open the file panel and switch to the Review tab. Statistics is the third section, under Issues and Coverage. On phones and tablets, statistics live at the bottom of the Reports screen.
What it shows
- A Characters and Locations chart pair, switchable between Bar Chart and Pie Chart — handy for spotting which characters or locations dominate your script.
- Totals: N Characters, N Scenes, N Locations.
- Estimated dialogue minutes and action minutes.
If your script embeds other scripts, the included sub-scripts count toward page counts and runtime.
The status bar
The right side of the status bar tracks where you are and how long the
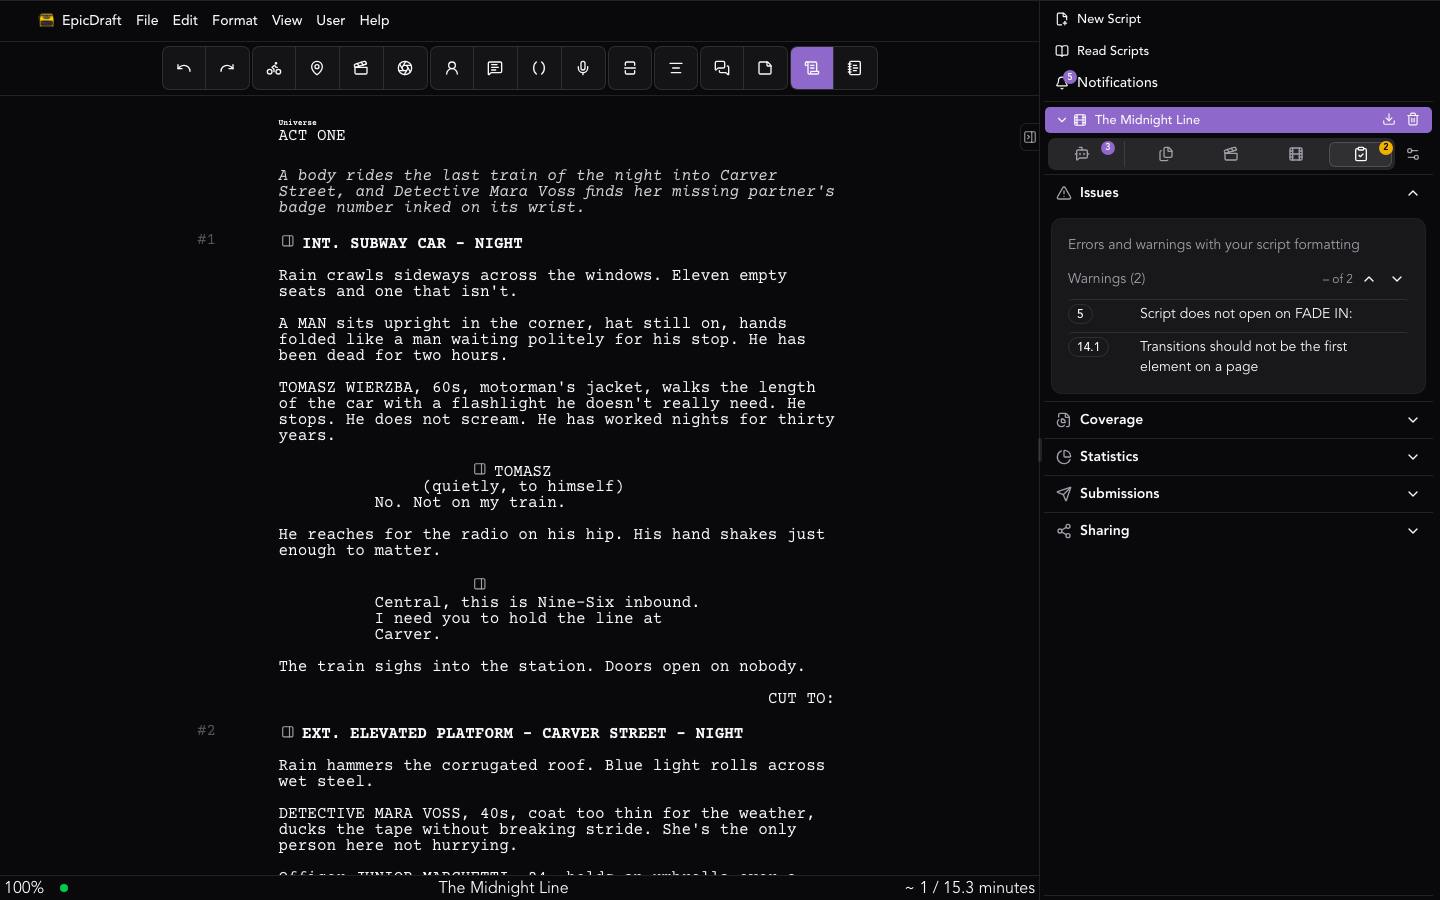
script runs: your page and scene position, and an estimated runtime. In
Ads and Content mode it shows a duration budget instead — 0:24 / 0:30
— which turns red when you're over budget. See
Story Modes.
You can hide the status bar from the View menu (Toggle Status Bar).
Issues
A built-in linter flags formatting errors and warnings. Issues is the first section of the Review tab — click any entry to jump the editor straight to the line it's about. The badge on the Review tab counts outstanding issues.
Per-medium craft checks
Each story mode adds its own guidance to the Issues list:
- Television checks act structure.
- Stageplay flags screen-style transitions, camera directions, and sluglines.
- Documentary flags untracked elements.
- Ads and Content checks duration, a call-to-action, and a late hook.
- Game checks choices, variables, and include targets.